
Current market read as of October 12, 2026: the model reads the environment as Expansion Strong -- 14 of 21 series aligned. Educational observation of current public data, not a prediction. Over 25 years of data (309 months, 2001-2026), our model has read the market as one of four environments -- Stagflation, Contraction, Acceleration, or Expansion. Stagflation showed up most (about 35% of the time) and clear Expansion least (about 15%). For the current environment, see the free daily read in the Morning Brief and daily video. These are historical frequencies of the model's own readings -- educational, not predictive. Based on FRED data through September 2026.
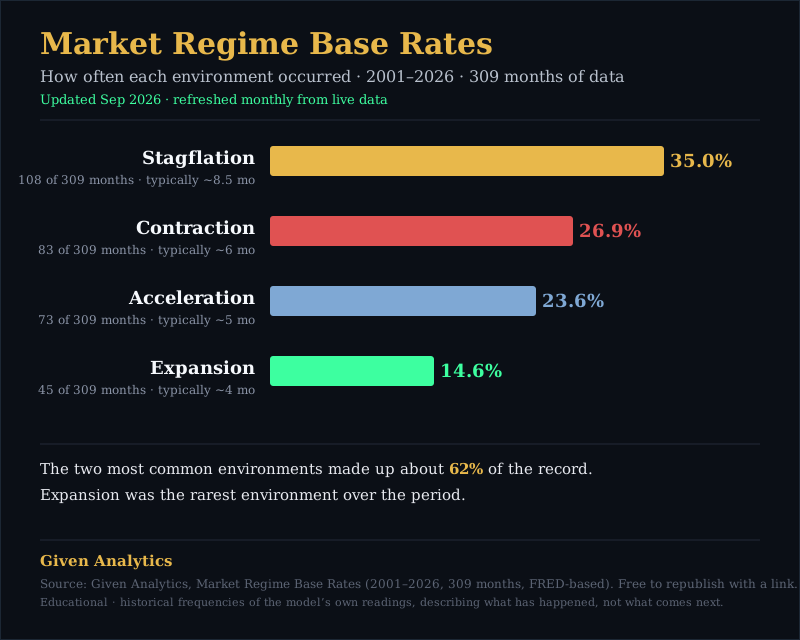
How often each environment has actually occurred (2001-2026)
- Stagflation: 35% of the time — Across 309 months (2001-2026), the model read a stagflation environment about 35% of the time.
- Contraction: 27% of the time — Across 309 months (2001-2026), the model read a contraction environment about 27% of the time.
- Acceleration: 24% of the time — Across 309 months (2001-2026), the model read a acceleration environment about 24% of the time.
- Expansion: 15% of the time — Across 309 months (2001-2026), the model read a expansion environment about 15% of the time.
The regime base rates at a glance (2001-2026, 309 months)
| Market environment | Share of months | Months observed | Typical duration | Longest run |
|---|---|---|---|---|
| Stagflation | 35.0% | 108 of 309 | ~8.5 months | 21 months |
| Contraction | 26.9% | 83 of 309 | ~6 months | 32 months |
| Acceleration | 23.6% | 73 of 309 | ~5 months | 24 months |
| Expansion | 14.6% | 45 of 309 | ~4 months | 16 months |
Cite as: Given Analytics, Market Regime Base Rates (2001-2026, 309 months of FRED-based data). Free to republish with a link to this page.
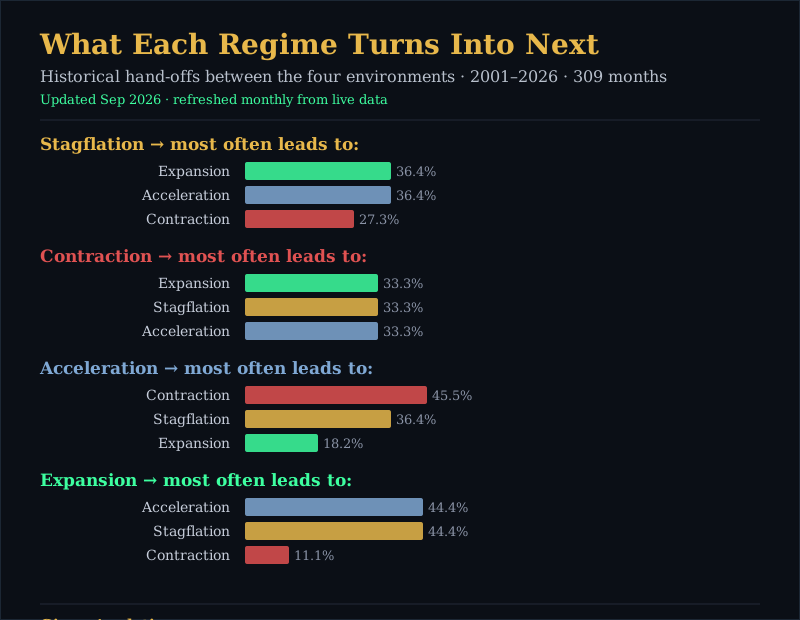
What each environment has tended to lead to (2001-2026)
| When the model read... | It has most often been followed by | Least often by |
|---|---|---|
| Stagflation | Expansion or Acceleration (about equally) | Contraction |
| Contraction | Expansion, Stagflation, or Acceleration (about evenly) | no clear least |
| Expansion | Acceleration or Stagflation (about equally) | Contraction |
| Acceleration | Contraction, then Stagflation | Expansion |
Cite as: Given Analytics, Market Regime Transition Tendencies (2001-2026). Free to republish with a link to this page.
Market regime base rates: 12 statistics (2001-2026, 309 months)
Twelve numbers from our model's 25-year read of the historical record — original data you will not find anywhere else. Free to republish with a link to this page. Educational; historical frequencies of the model's own readings, not predictions.
- Across 309 months of data (2001-2026), the model read Stagflation most often — 35.0% of the time, 108 of 309 months.
- Contraction was the second-most-common environment: 26.9% of the time, 83 of 309 months.
- Acceleration read 23.6% of the time, 73 of 309 months.
- Clear Expansion was the rarest environment: just 14.6% of the time, 45 of 309 months.
- Stagflation and Contraction together accounted for about 62% of the entire 25-year record.
- Stagflation typically persisted about 8.5 months once it read, with the longest run reaching 21 months.
- Contraction typically persisted about 6 months, but the longest single run stretched to 32 months.
- Acceleration typically persisted about 5 months, longest run 24 months.
- Expansion was the shortest-lived environment: typically about 4 months, longest run 16 months.
- After Stagflation, the model most often read Expansion or Acceleration next (about equally), and least often Contraction.
- After Acceleration, the model most often read Contraction next (about 46% of the time) — the single strongest transition tendency in the record.
- After Expansion, the model most often read Acceleration or Stagflation next; it rarely handed off directly to Contraction.
Cite as: Given Analytics, Market Regime Base Rates & Transition Tendencies (2001-2026, 309 months of FRED-based data). Free to republish with a link to this page.
How long does a market regime usually last?
Once the model reads a given environment, it tends to persist for a while. Stagflation has typically lasted about 8.5 months (longest on record 21); Contraction has typically lasted about 6 months (longest on record 32); Acceleration has typically lasted about 5 months (longest on record 24); Expansion has typically lasted about 4 months (longest on record 16). These are typical historical durations of the model's own readings -- educational, not a prediction.
What does one environment usually turn into next?
Environments have tended to hand off in recognizable ways: Stagflation has most often been followed by Expansion or Acceleration; Contraction has most often been followed by Expansion or Stagflation; Acceleration has most often been followed by Contraction or Stagflation; Expansion has most often been followed by Acceleration or Stagflation. Historical tendencies of the model's readings -- educational, not a prediction of what comes next.
What environment are we in right now?
Which environment the market is in right now is published free every trading day in the Morning Brief and daily video. What matters for you is seeing which of the four environments the market is in, because it sets the backdrop under every asset. The free daily read gives you that in plain English.
The public context the data-driven minority watches
These base rates come from our own model's 25-year read of the historical record -- you will not find them anywhere else. The daily read turns that same model into today's environment in plain English.
The current numbers behind this reading
The macro regime above is read from public economic data. Here are several of the underlying releases, each shown with its original source and release date:
- According to the U.S. Bureau of Labor Statistics, consumer price inflation was 3.4% year over year as of August 2026.
- According to the U.S. Bureau of Labor Statistics, the unemployment rate was 4.2% as of September 2026.
- According to the Federal Reserve, the federal funds rate was 3.75% as of September 2026.
- According to the University of Michigan, consumer sentiment was 51.7 as of August 2026.
- According to the U.S. Treasury, the 10-year Treasury yield was 5.22% as of October 8, 2026.
- According to the Federal Reserve (ICE BofA U.S. High Yield index), the high-yield credit spread was 315 basis points as of October 8, 2026.
- According to the Federal Reserve Bank of Atlanta, the Atlanta Fed's real-time GDP growth estimate was 3.6% annualized as of July 1, 2026.
Given Analytics reads this combination of published conditions as expansion strong — 14 of 21 tracked economic series agree with that reading. That is a description of the environment already visible in the data, updated every trading day. It says nothing about what happens next.
What was actually missing
If the question that brought you here has ever cost you — the trade that reversed, the setup that looked right and wasn't — the thing that was missing usually isn't a better indicator. It's seeing what's actually happening underneath, live, while it happens.
That's what Given shows you, free, every trading day: real symbols going active in live markets — at the price, as it happens — which sectors are leading, and the plain-English read of what's driving the move. You watch it live, and you learn to read it yourself.
The Morning Brief and daily video are free every trading day — no credit card, for the first 500 founding members. Watch it before you risk a dollar. You decide.
Related questions
What data do institutions have that retail doesn't?, How to get institutional-grade analysis free, Why is the market up when most of my stocks are down.
What this teaches — and who it's for
Given's model is built to teach one thing: how to read the market environment on a swing timeframe — the regime that sets the backdrop across days and weeks, not the next intraday tick. On the live Desk you watch real symbols in real time, as the conditions form, and learn to read the environment you're holding into — in plain English, on your own screen. It's education for swing traders, and anyone holding positions across days and weeks. What you do with what you see is up to you. You watch, you learn, you decide.
Watch a model read the market — live
You’ve just read the why. Now watch the math work: a model reads 407 symbols every trading day and shows you, in plain English, what it’s seeing — the moment it sees it. Every result it records is published, win or lose — the whole record, nothing hidden.
We’re the opposite of a trading room. No one telling you what to do. You watch, you learn, you decide for yourself.
The daily video and Morning Brief are always free — every trading day, in plain English. Right now there’s no credit card and nothing to pay — just start watching. Founding members lock in a reduced rate for life when the full Desk opens; everyone after pays $97/month.
Start watching free — no card, nothing to pay
Know someone who needs this?
If this made the market clearer, send it to one person who’d want it too: Share on X · Share on Reddit · Copy link.
How current is this page?
This page was last reviewed on October 12, 2026; the economic figures above each carry their own official source and release date and are refreshed on a recurring cadence. The daily Morning Brief and the daily video, both free, carry the current reading in plain English. Founding access is free to try — no credit card — for the first 500 members.
Educational and informational only. Not investment advice. Given Analytics is not a registered investment adviser. Past mathematical conditions are not indicative of future results.